On 20 October 2022, insightsoftware hosted a webinar for its customers which covered the differences between Jet Reports, and Microsoft Power BI.
Presented by Bryan Weaver, Solutions Engineering Strategist for insightsoftware, the webinar covered the pros and cons of Jet Reports and Power BI, and how they’re better when used together.
As an award-winning Microsoft Dynamics partner in Singapore, as well as a Top Elite Partner of the Year for insightsoftware, we at AFON have had the opportunity to sit in on the webinar, and bring some of the highlights to you.
Let’s take a look at some of the biggest highlights of the insightsoftware webinar, “Jet Reports & Power BI – What’s The Difference?”
They’re Not Competing Solutions – They’re Very Different Software Entirely
Demonstrates the flexibility and ease of use of Jet Reports’ Table Builder function to provide complex filtered information for consumption in Power BI; Source: Jet Global
One of the first things that the webinar emphasised is that Jet Reports and Power BI are not competing solutions that do the same thing, and that directly comparing them is like comparing apples to oranges.
Instead, they’re two very different software products which work differently, and do related but very different things.
In the case of Jet Reports, it’s a financial and operational reporting solution that’s built inside and makes use of Microsoft Excel.
The reporting solution is purpose-built for Microsoft Dynamics solutions such as NAV, Business Central and GP, and it’s designed to provide real-time reporting using live data from the ERP software.
On the other hand, Power BI is a business intelligence (BI) service that’s primarily designed to provide self-service visualisations and interactive dashboards that present the company’s data in an easy-to-digest format.
Unlike Jet Reports, Power BI is a generic tool that can be used with a wide variety of data sources. Additionally, its data models are refreshed in advance of reporting, unlike Jet Report’s real-time reporting capabilities.
Jet Reports Offers Greater Ease Of Use For Finance Professionals
%20(1).webp?width=1000&height=666&name=jet-reports-feature-2_2_%20(3)%20(1).webp) Overview of Jet Reports Dashboard ; Source: Jet Global
Overview of Jet Reports Dashboard ; Source: Jet Global
The main advantage that Jet Reports has over Power BI is how easy it is for finance professionals to quickly generate real-time financial reports with a click.
Selecting the ‘Fast Financials’ options within Jet Reports offers the user a choice of data to include in a report. Once the user has made their selection, it automatically generates a table based on their choices displaying the financial data relevant to their query.
Data can be added or removed from this table as needed by the user, and it can all be done by the finance professional user without needing to get other parties involved.
On the other hand, using Power BI to generate reports requires that the business has a developer versed in Visual Studio Code to integrate the BI solution with Microsoft Dynamics 365 Business Central, so it can draw data from the ERP software.
Power BI’s report templates are also designed to be useful for very specific queries, but the generated reports will need to be managed by the developer.
Therefore, it requires more investment from the business to make use of Power BI, compared to Jet Reports.
Power BI Generates Interactive Reports For Consumption By Executives
Introductory 1- Min Clip on Power BI And Its Features ;Source: Microsoft Power BI
The Excel tables generated by Jet Reports serves its purpose of putting financial data at the fingertips of your finance professionals. However, what if they need to present the same data to upper management?
While your financial professionals have the training to decipher insights from Excel spreadsheets alone, your executives will likely need a little more help. And that’s where Power BI comes in handy.
With its ability to take raw data and generate fully interactive dashboards from it, Power BI gives you an easy way to visualise financial data for the consumption of your business’s upper management.
These dashboards are also fully customisable, which means you can draw the attention of your audience to the most salient details by choosing which charts and figures are included in the dashboard.
Where Jet Reports excels in generating financial reports that provide actionable insights, Power BI is more suited to visualising these insights into a form that’s more easily consumable by your upper management, thus helping them make data-driven business decisions.
Which Power BI User Licence Works Best For Your Business Needs? Find Out Here.
Jet Reports And Power BI Work Best In Tandem
Discover what's Power BI and how it can become more powerful when combined with Jet Reports ; Source: Jet Global
Power BI is designed to draw data from a range of sources, and Jet Reports can serve as one of these data sources. Thus, you can take advantage of their synergies when you use both solutions together.
Using Jet Reports, you can use its Table Builder tool to construct a tabular data model, and subsequently generate a financial report that includes all of the relevant numbers. You can also schedule automatic refreshes as required, ensuring that the report reflects data on your business in real-time.
Power BI can then use the Excel spreadsheet generated by the Table Builder in Jet Reports as a data source. Using the data imported from it, the BI solution can then build the interactive dashboards and visualisations that are destined for consumption by the upper management business.
With this, both your financial professionals and your upper management executives will gain access to the same set of actionable insights, ensuring that they can utilise it to make informed decisions that promote the profitability and success of your business.
Make Insights More Accessible At All Levels With Jet Reports And Power BI
What we’ve covered are some of the highlights of insightsoftware’s webinar, and there’s more to it if you’re interested.
If you’ve missed the webinar or would like the chance to find out how Jet Reports and Power BI are best used together to great effect, you can access the webinar-on-demand here.
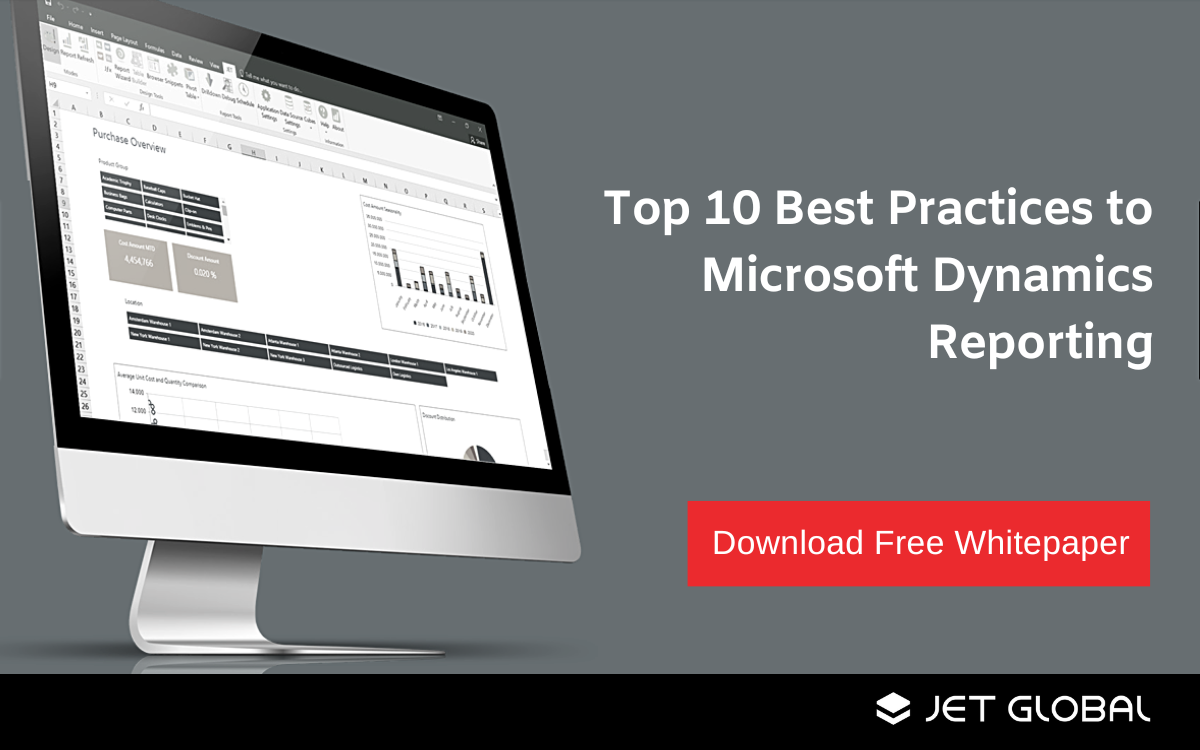
Or if you’d like to know how to use Jet Reports to its fullest potential, click on the image below to find out about the top 10 best practices for business reporting within Microsoft Dynamics.
Finally, if you prefer to speak to an analytics and reporting tools expert, just drop us an enquiry here.
As a Top Elite Partner for Jet Global, we can help you set up and integrate Jet Reports with your Microsoft Dynamics ERP software.